NGC 5286 is a very old globular cluster in the milky way galaxy, its estimated to be one of the oldest globular clusters with an age around 12.5 billion years old. It’s located around 36,000 light years away in the southern hemisphere in one of the largest constellations, Centaurus. It was discovered by Scottish astronomer James Dunlop who was active in Australia, and listed in his 1827 catalog. (Link)
In order to study NGC 5286 and investigate the relationships between the colors, brightnesses, and the age and chemical composition of the cluster as a whole, I used the skynet robotic telescope network website to set up my observations. The constraints on the observations were as follows, Set Max Sun Elevation to -15, Min Target Elevation to 30, Max Moon Phase to 50, and Min Moon Separation to 60. Leave other values as defaults. After choosing my constraints, I selected the telescopes I wanted to use for the observation. I chose Prompt2, Prompt5, PROMPT-MO-1, and PROMPT-USASK. The telescope that ended up taking the observations was the PROMPT-5 telescope for all 15 observations. After choosing the telescopes, we had a list of filters to choose from for this observation, I chose the filters from B, V, and R from “Johnson/Cousins”. I collected 3 sets of 5 observations, each in 3 separate filters, B, V, and R. The durations for each filter were 70 sec for B, 30 sec V, and 30 sec for R.
In the afterglow website I aligned and stacked the separate B, V, and R filtered observations into 3 separate stacked images of B,V, R respectively and I measured the apparent brightness using batch photometry on those 3 separate stacked images. I then stacked those 3 stacked B, V and R images into 1 uncorrected color image. I then took the batch photometry excel file that afterglow created and gave it to the cluster pro website to create the graph representation of NGC 5286.
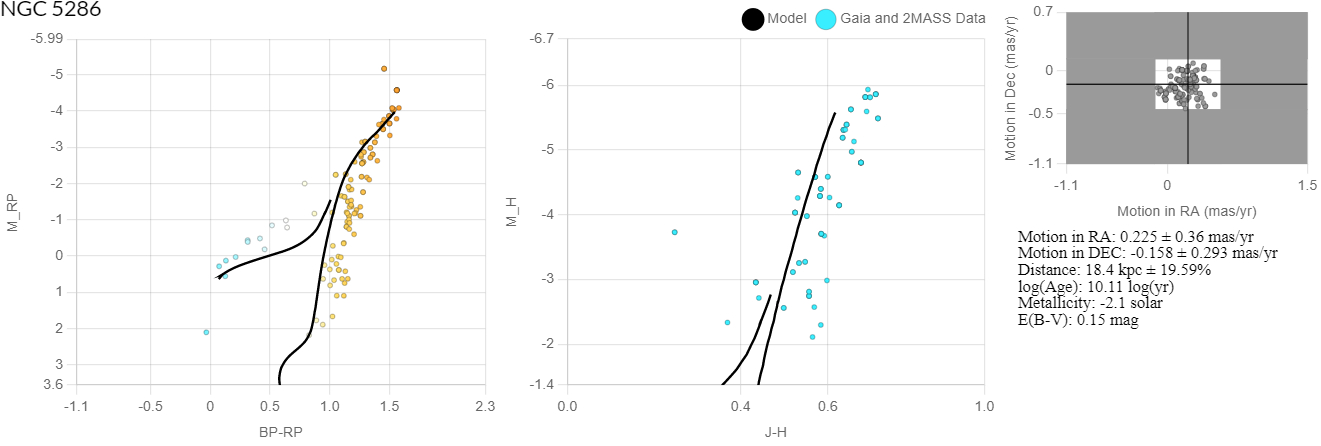
In the cluster pro plus website, I gave the website my excel sheet data and it created a graph with all the stars seen in the vicinity of the sky of NGC 5286 as dots in the graph. Then I constrain the proper motion values to isolate the stars that actually belong to NGC 5286 so there are less inconsistent data points. After constraining the proper motion, I am left with a graph of scattered dots, to make sense of these dots, I have to determine the distance that NGC 5286 is from the earth in kilo parsecs (KPC), this gives the graph a shape that gives a clear turning point off the main sequence and that we can fit the isochrome model to. After determining the distance, I had to fit the isochrome model to the data and determine its turn off point from the main sequence by adjusting the age (in years), the metallicity (in solar masses), and the E(B–V) Reddening (mag).
After fitting the isochrome model to the turning point, I took the E(B–V) Reddening value and returned to afterglow. I saved the graph and I used the E(B-V) value to correct the reddening from the stellar extinction in the uncorrected stacked color image to create a corrected/de-reddened color image.
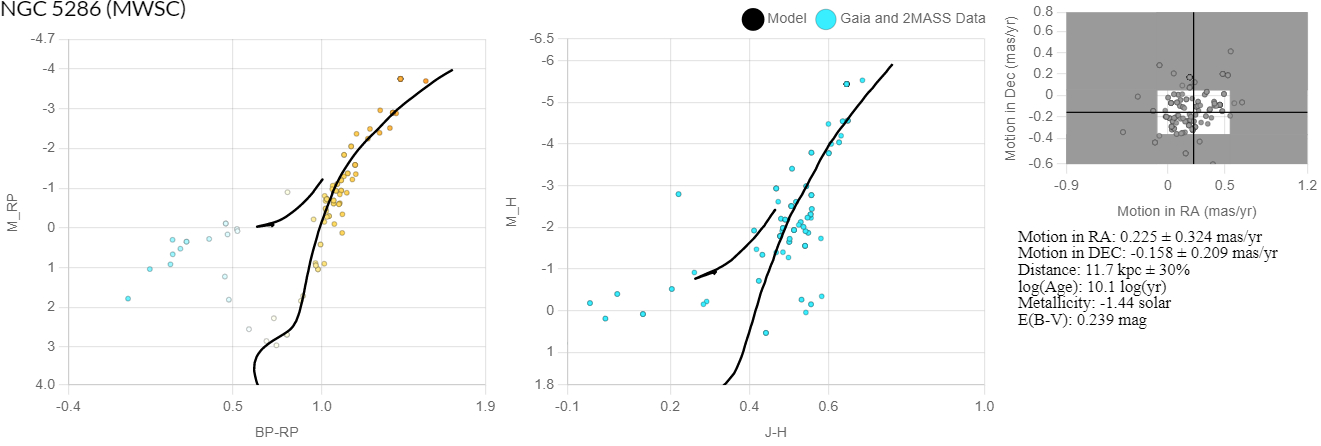
After determining my own graph parameters by fitting my own isochrome model to the turning point by changing the such as distance, age, metallicity and reddening values to match the turning point. After all this was done, I made another graph using the parameters outlined in the study done by Kharchenko et al in 2013 (Link). I did this to compare my isochrome model fit to their fit to determine which was more likely to have accurate parameters.
I did this to learn more about the effects of interstellar extinction and to be able to directly see the difference between reddened/uncorrected and de-reddened/corrected images. For the most part, the stars in NGC 5286 have all turned off the main sequence and turned into red giants or are on the horizontal branch; this is to be expected since this is a globular cluster, one of the oldest types of clusters. However there are blue stragglers that remain in the cluster, these blue stragglers, if removed, would give a more accurate color picture of NGC 5286. Fitting the Isochrome model to the turning point was a bit challenging because of how far and old this cluster is, and because there are a fair amount of blue stragglers that are inconsistent with what is expected of a globular cluster of this age.
Reddened/Uncorrected: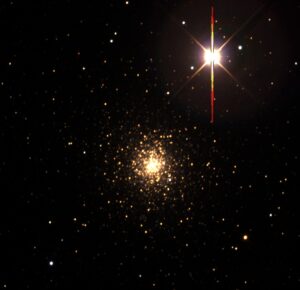 |
De-Reddened/Corrected: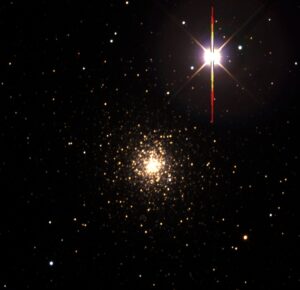 |
| Kharchenko’s Parameters
Motion in RA (mas/yr):0.225 ± 0.324 |
My Parameters
Motion in RA (mas/yr):0.225 ± 0.36 |
The observations I took of NGC 5286 came back oversaturated and contaminated with the light of a nearby bright star and thus a red line appears to streak from the brightest star in the observation.
Overall, it was really cool to learn about celestial bodies that are so far away from earth and to see some different examples about how much variation each star can have. I really enjoyed being able to put some visual references to terms we have learned about, looking at space gives some of the most breathtaking views you can ever see.