NGC 5925 is an intermediate age cluster estimated to be around 316 million years old, it’s located in the Southern constellation Norma. It is an open cluster that is 5070 light years away from Earth.
A recent study made in 2021 found that in NGC 5925, the average number of blue straggler stars (BSS) increases with cluster age and mass and that there is a power-law relation between the cluster mass and the maximum number of BBSs in it. They found that at least 54 percent of BSSs have fractional mass excess (Me) less than 0.5, where it is likely to have gotten its mass through binary mass transfer. 30 percent in the 1.0 < Me <0.5 range likely gained mass through a merger. and up to 16 percent with Me > 1.0 gained mass from multiple mergers.
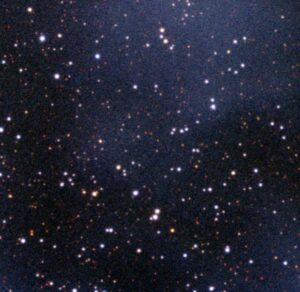
To study NGC 5925 I collected 15 images in B, V, and R filters with exposure durations of 120s, 60s, and 30s respectively, with an hour between each photo at 5 photos per filter, using PROMT-MO-1 located in Meckering Observatory on Skynet. I then used Afterglow to obtain the photometry of each source of light. I also made a tri-colored image:
I then took the photometry and uploaded it to Cluster Astromancer to obtain the data about my cluster. After using Field Star Removal, Archive Fetching, and then Isochrone Matching, I was able to find data on my star cluster.
| Proper Motion RA | Proper Motion DEC | Distance | Log Age | Age | Metallicity | Reddening |
| -4.46 (mas/yr) | -5.03 (mas/yr) | 1.47 (kpc) | 8.7 log (yrs) | 501.19 (Myrs) | 0.35 (solar) | 0.45 (mag) |
I then used the Reddening ( E(B-V) ) to create a de-reddened image:
 This was all done to research and retrieve data from NGC 5925, I learned a lot throughout the entire process about refining stars and capturing images but mainly how vast the galaxy is, for just this cluster there are thousands of stars inside it. There are some interesting points in my cluster like the presence of blue stragglers, which as mentioned above were a part of a study. The most challenging part was that since my cluster was a smaller one, I had to constantly refine the stars to be able to get a good sample size.
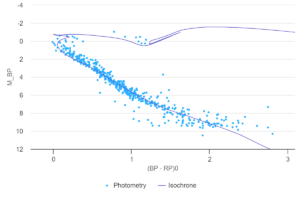
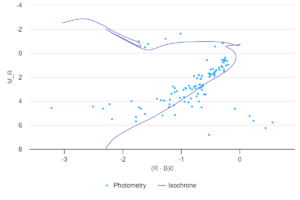
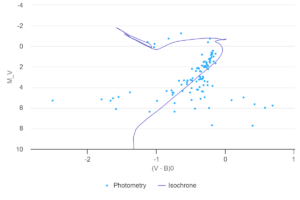
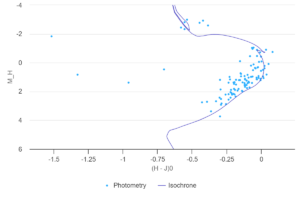
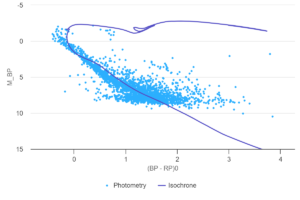
NGC 5925 was studied by Kharchenko et al (2013) who found parameters. I plotted the Gaia data with those parameters and found
(My graphs)
| RP vs BP – RP | R vs B – R | V vs B – V | H vs J – H |
 |
 |
 |
 |
(Kharchenko graphs)
| RP vs BP – RP | H vs J – H |
 |
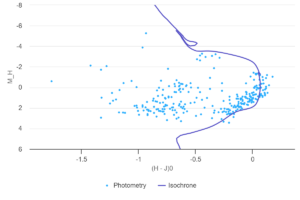 |
As we can see when we compare Kharchenko’s graphs and mine, mine is fairly similar except the higher quadrants on both graphs are slightly different while the lower half stays relatively the same. I would say the MWSC graph is better fitting mainly on the higher quadrants as my values don’t differ too much but enough to make a noticeable difference.
Having completed my analysis I had a fun time learning more about NGC 5925 and its many stars, I believe I did it justice and am thankful that I got to look into the vastness of space and pick out a little part to analyze. I very much enjoyed taking the pictures and extracting the data from them as well as tinkering around with different colors. It was overall a cool experience that I would like to do again someday.