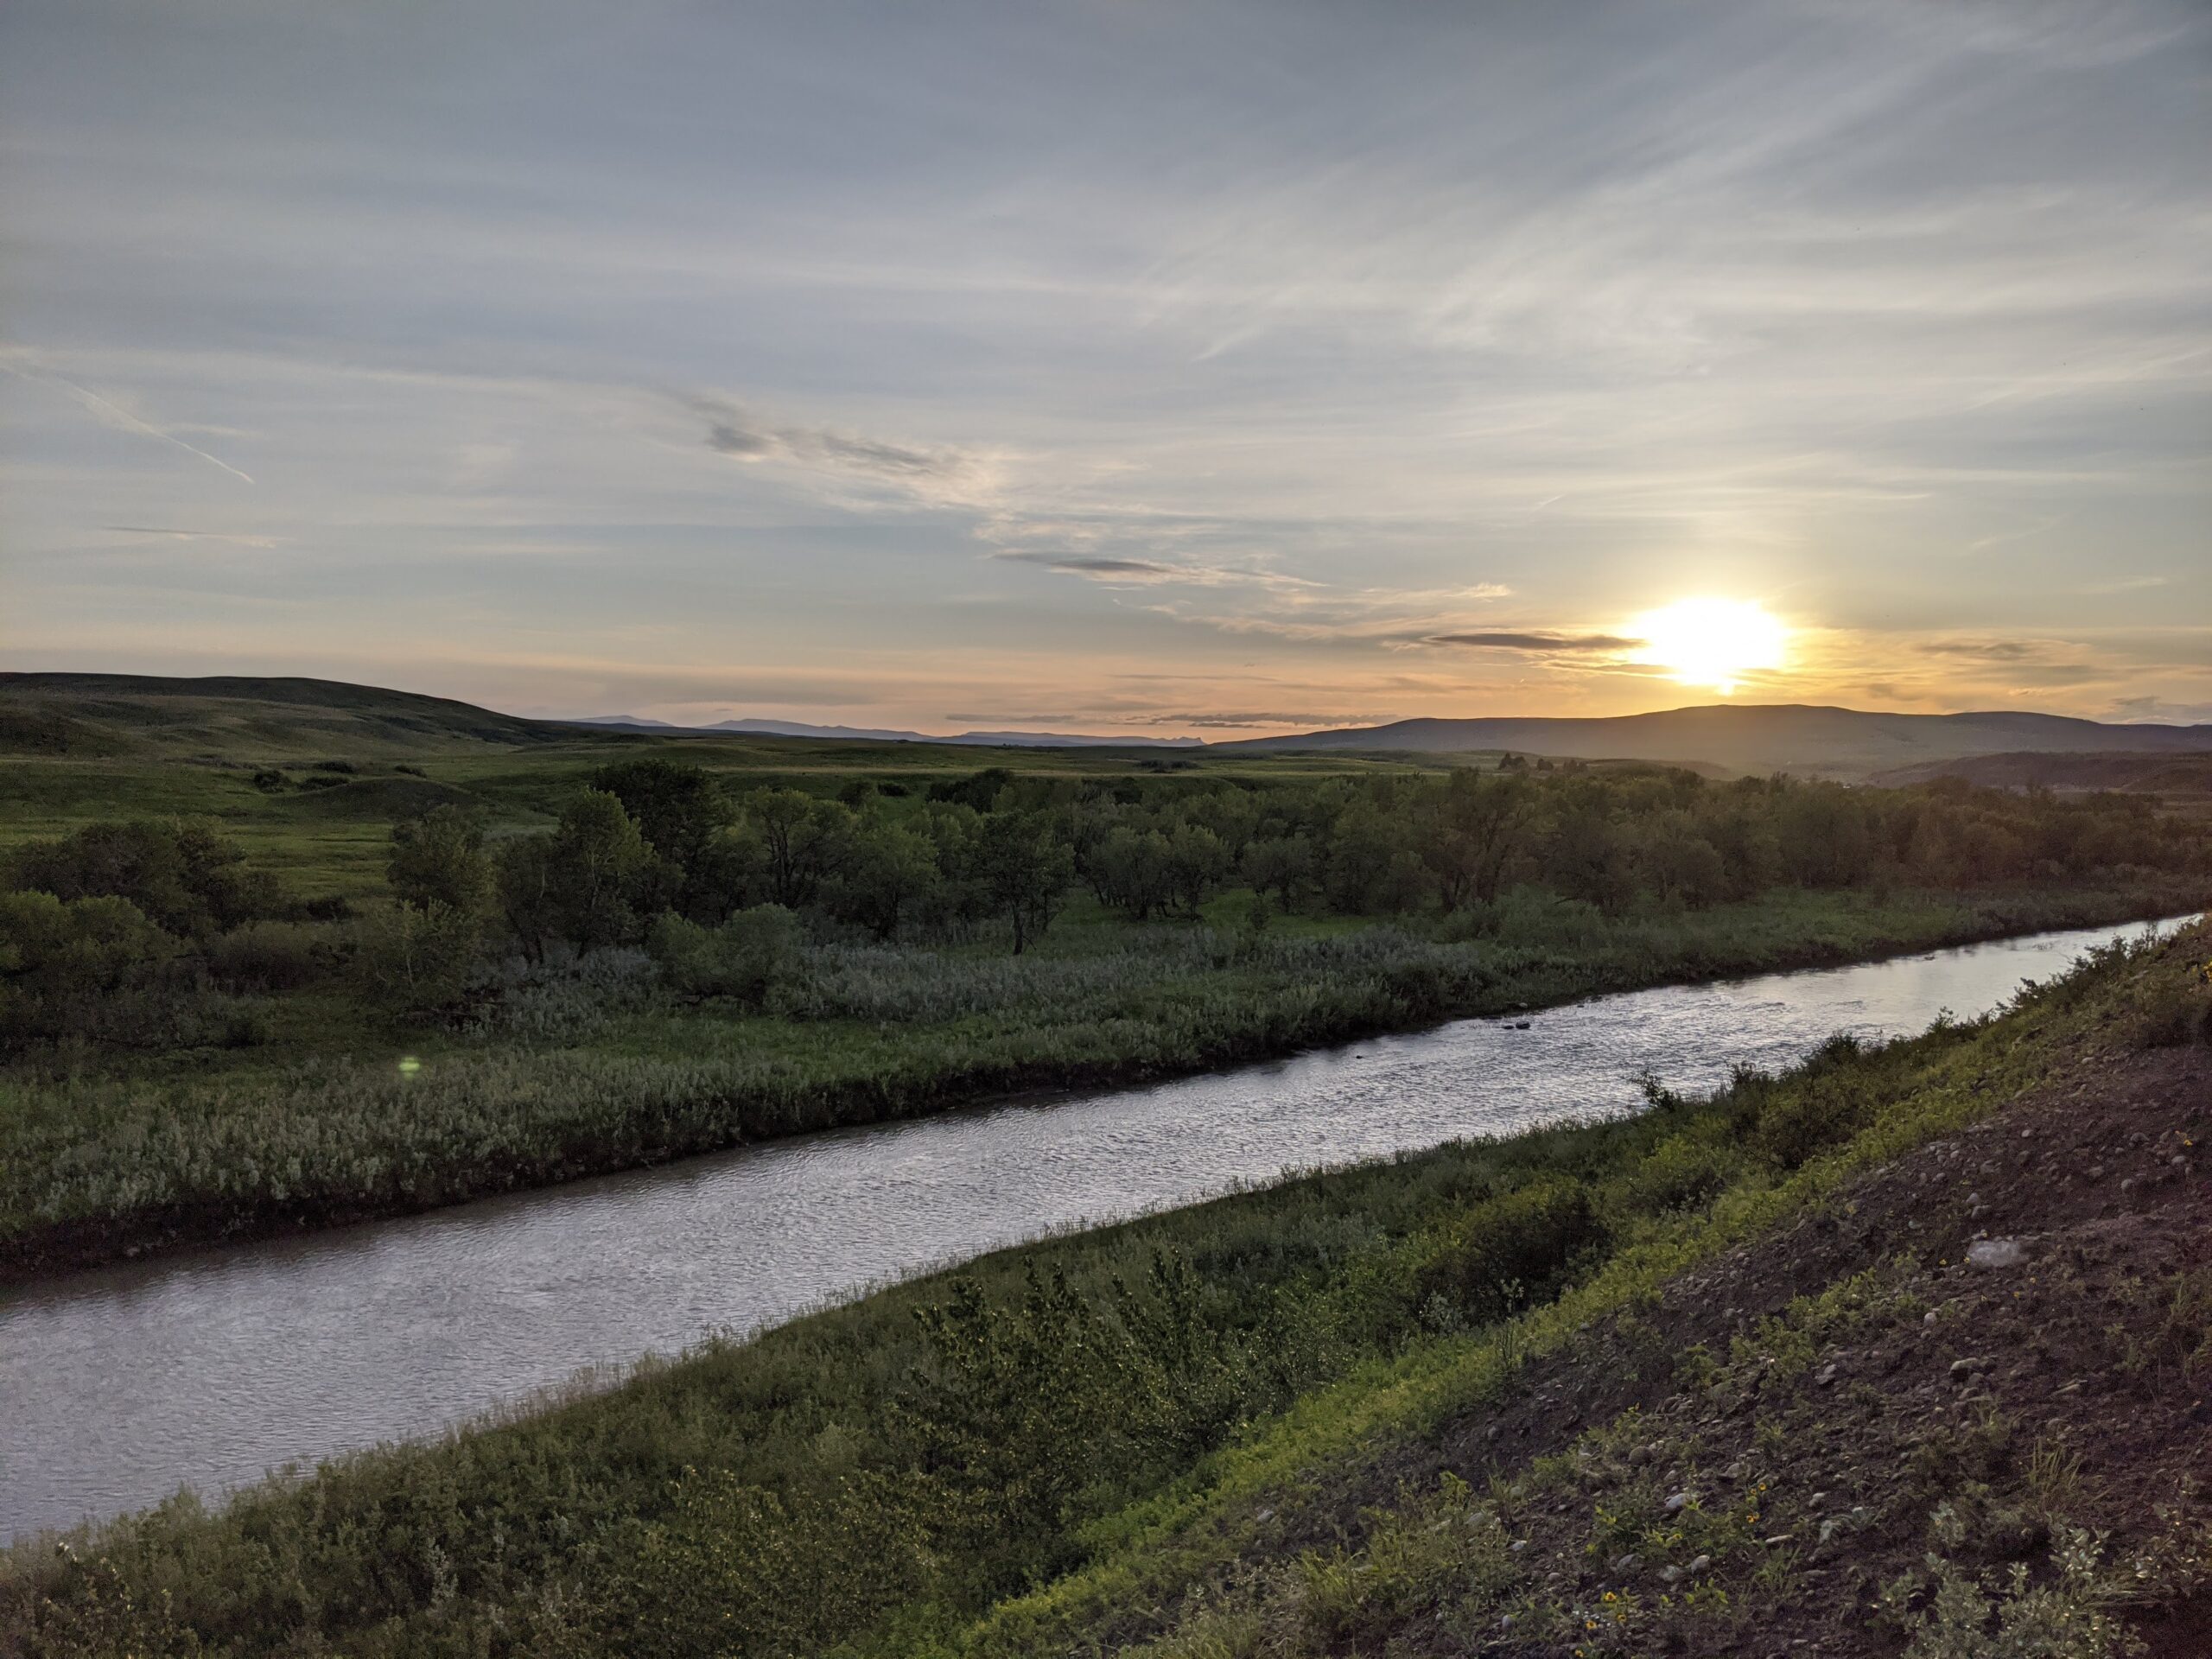
Admittedly, I have not encountered many extensive or useful databases in my life. High School was a slow transition to online learning, while most of my university experience has been textbooks or simple online searches for formulas, physics explanations, and circuit diagram examples. Clearly I have used minor databases, but to manually comb through and study large historical databases is something I have yet to do. An example of a database usage in my electrical engineering student experience has been using datasheets for electrical components when designing and building circuits. There are numerous types of op-amps, diodes, integrated circuits, and other circuitry parts that are required to have detailed information about their usage, price, load maximums / minimums etc. in order to be used quickly and efficiently by engineers. It is not uncommon for the manufacturers of these devices to have simple online databases stored on their corporate websites. For example, in one of my micro circuitry labs I was required to use and incorporate a “1N4148 Small signal fast switching Diode” in a sensor type device / circuit. In order to use this we need to know everything about this diode before we plan our design. So we would access the vishay.com website, search for our desired diode, and eventually find the pdf of the data sheet. Attached is an example of what the datasheet may look like.
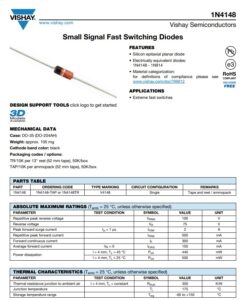
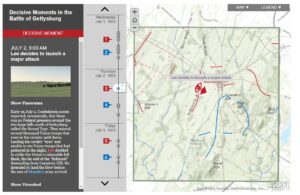
This is just page one of an extremely detailed document filled with all the specifications you will need to meet in your design. Clearly, engineering specifications databases are going to be noticeably different from a historical database. When discussing components and specifications, the bare minimum is needed in terms of graphical interface, and merely a search bar will suffice to find the required information. Meanwhile, when discussing issues such as migration, historical battles, weather patterns, oftentimes a simple search engine is not enough to create and maintain an efficient database. As shown with the “A Cutting-Edge Second Look at the Battle of Gettysburg” article by Anne Kelly Knowles, interactive exhibits are a great method of getting historical data across without data tables and plain information. By utilizing HGIS software and interactive information elements, Knowles created an interesting “database” of sorts that did not require searching just for the elements you would like or need to know; the exhibit allowed any user to discover and fully understand the battle as it happened, without sacrificing any information. If anything, it would have provided more than the conventional textbook, or in the datasheets case raw lines of data.
In class, our closest look at an online database would have been the project last week where we discovered how to use ArcGIS software to examine Canadian census data. Depending on how far each student got, we ended up using government data to analyze the soil landscape data of PEI in the year 1971 using 1951 geographical boundaries data. In my upcoming final project I plan to use ArcGIS a lot, as a fair bit of my project will be discussing and delving into the movement of my family from Germany in the early 1900s, to their eventual migration to Canada. Government data will be very useful, although many iterations of maps will be have to used for German regional boundaries as the landscape in the early 1900s was very turbulent due to the two world wars. Hopefully the secretive nature of Russian regional data will not be a huge hurdle for me when delving into the cold war era of Germany.