
Ngc 2627 is a star cluster, in terms of human years. For stars, 1.6 billion years is not really all that old, which would place it closer to being an intermediately aged star cluster. It can be found within the constellation of Pyxis, though only about 15 stars are going to be visible with the naked eye. to be honest, unlike other clusters, there is nothing really fun about Ngc 2627. It was found, and then nothing interesting was discovered about it. It more or less just exists, sitting there, looking really pretty. More specifically, Ngc 2627 is an open star cluster in the western part of the ‘compass’ constellation and was found by John Louis Emil Dreyer, a Danish astronomer.
Herschel (2007) found that although the cluster is extremely faint and challenging to see, it spans around 10′ throughout the night sky. With a low magnification it only appeared to be 17 stars, but after raising the magnification to around 70x, the rest of the stars can come into view. Herschel described the cluster as looking like the letter y in the night sky, if the letter were to be laterally displaced that is.
In order to study the cluster Ngc 2627 and the relationships between the colours, brightnesses, age, and chemical composition of the cluster as a whole, I collected a total of 20 images over a few days using several different color filters. The telescope used for the endeavor was the ‘prompt5’ telescope on the Skynet website. Through Skynet I was able to take pictures with exposure times of 24, 36 and 97 second exposure times on R, V and, B filters, respectively. After the images were taken and returned to me, I was able to use the afterglow software through Skynet to extra data from the photos, as well as color correct. Using the data from afterglow I created a graph using Cluster Pro Plus to estimate several factors of Ngc 2627
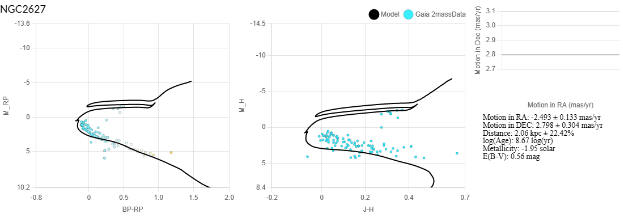
This originally had been done because it was an assignment I had for a class, but it had quickly become an item of interest for me. Through this I picked up enough technical knowledge that I was able to extract data from a picture, to find a decent estimate for how old a cluster is, how far away it is, and even how much dust there was between me and the stars. While there were no blue stragglers to make the analysis harder, it was still a challenging process to try and figure out which red giant branch fit my cluster the best. I could have very easily been wrong about my choice, but after looking at other peoples data I think I was decently close, as it got me the estimate of the age being 10 to the 8.67 years old with a metallicity of -1.95 solar. As for distance, I found it to be around the 2.06 Kpc range, give or take around 20%. Finally, I believe around 0.56 magnitudes of stellar dust is between the cluster and earth.
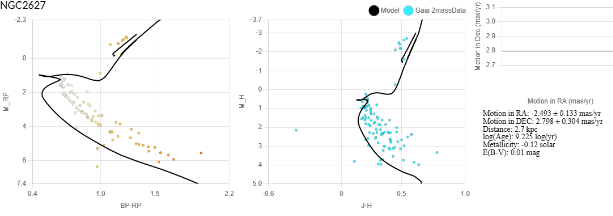
A study done by Kharchenko et al (2013) found values that were slightly different than mine, however some of them were similar. What they found indicated that the age of the cluster should be around 10^9.225, the metallicity would be about -0.12 solar, the distance 2.7 Kpc and the amount of Dust being 0.01 magnitudes. I would say the age and the distance are similar, but the metallicity and dust would be completely different. While my first instinct was to just go ahead and say I was probably wrong, I do not think the graph of their data looks nearly as clean as mine does, which makes me believe something of theirs is wrong. Unlike my graph where the data points line up, the data points in their graph are no where near touching the line, as they are constantly too high. If this were to be simply chalked up to a interstellar Redding miscalculation, then the red giant branch of their graph would be even further off of where it should be, meaning age or metallicity would have to be incorrect as well. I would have to argue that my data and finding are as such better, because my numbers fit the data better.
Overall, even if my numbers and finding are actually wrong, I am still glad that I was able to observe a star cluster. It was a really cool experience, and something I would definitely want to do again. Having taken my own pictures of the cluster, even without analysis of the data that comes with them is cool. Getting to align all of the photos and then take some of the red color shifting out of them to end up with my own photo, something that I created was a great experience. It is definitely something that I would recommend others to do, as it just feels rewarding to be honest.