Choosing the right metric for Facebook advertisements: a (very) small case study

by Joanna Hare, Run Run Shaw Library, City University of Hong Kong

Following on from my previous Brain Work blog post about Facebook Insights, for this post I would like to share my recent experiences of utilising paid Facebook advertising for our library’s Facebook page.

Starting in October 2016 my library has been experimenting with paid Facebook advertising. Using a modest budget we have run two broad categories of advert:

  1. Page Likes: An advert shown to our specified target audience to invite them to like our page.
  2. Boosted Posts: Promote a single post from our Page to help it reach both our existing fans and people who have not ‘Liked’ our Page.

This is the second semester in which we have utilised paid Facebook adverts, which means I have been able to learn from the first semester and make adjustments for the second. For this post, I would like to reflect on choosing the right type of metric to be able to accurately assess the performance of your advert.

In the first semester of experimenting with Facebook advertisements, we boosted a post promoting our citation management workshops (Fig 1). In my previous experience, I had found Photo posts had performed better on Facebook than Link posts, so I used the same strategy in this advert.      

Fig 1: The first advert promoting our citation management workshops, run in November 2016.

Fig 1: The first advert promoting our citation management workshops, run in November 2016.


The results of this post were both encouraging and disappointing. While I was pleased that 54 people ‘reacted’ to the post, only 6 people clicked the link to view the workshop registration page. This indicated to me that people liked the content of the post (perhaps baited by a cute kitten!), but they were not so engaged as to take the extra step to click the link and view the workshop registration page.

To address this, in the second semester I used an advert type specifically designed to direct people to a destination off Facebook. The major difference is the ‘Sign Up’ button at the bottom of the post (Fig 2.), which when clicked directs users to the workshops registration page.   

Fig 2: The second advert promoting our citation management workshops, run in February 2017.

Fig 2: The second advert promoting our citation management workshops, run in February 2017.


The performance of this advert was much more encouraging: while only 6 people ‘reacted’ to the post, 93 people clicked the link to visit the registration page – a number greatly improved from the previous semester. Ordinarily the low number of reactions to a paid advert would be disappointing, but in this case, a high-click through result is preferable to lots of Likes.

In terms of the impact on workshop registrations, we did record a slight increase in the number of registrations and attendees, but certainly not an increase of 93 people, meaning not all of those visitors to the registration page actually registered for or attended the workshop. This could be a reflection of the design of the workshop registration page or the process of registration. This brings us to the next (much larger!) phase in our assessment of our Facebook adverts – to investigate their real-world impact outside of link clicks and post likes.

While Facebook is notoriously secretive of about how their algorithms work, they do provide a huge amount of data to demonstrate how your content is performing – and paid adverts are no different. Ultimately this exercise taught me to pay attention to the metrics used to assess the performance of Facebook adverts, and to choose an advert template that addresses the goal of placing the advert. This whole exercise forms part of a broader strategy in the Library to adopt an evidence-based approach to the use of Facebook to ensure our efforts on social media are worth the time investment. Based on the increased outreach and engagement with our posts thanks to paid advertising, our Library will continue to experiment with Facebook adverts in the coming academic year.

Recommended reading for anyone wanting to explore Facebook advertising for academic libraries:

  • Chan, Christopher, “Your Mileage May Vary: Facebook Advertising Revisited,” College and Research Library News, 77:4 (2016): 190-193, accessed December 21, 2016, http://crln.acrl.org/content/77/4/190.full
  • Scott W.H. Young, Angela M. Tate, Angela M., Doralyn Rossmann and Mary Anne Hansen, “The Social Media Toll Road: The Promise and Peril of Facebook Advertising” College and Research Library News 75:8 (2014): 427-434, accessed December 21, 2016,  http://crln.acrl.org/content/75/8/427.full   

This article gives the views of the author and not necessarily the views the Centre for Evidence Based Library and Information Practice or the University Library, University of Saskatchewan.

A small experiment to improve Facebook engagement

By Joanna Hare
Run Run Shaw Library, City University of Hong Kong

As I am sure is the case at many academic libraries, I am the sole person responsible for maintaining the Library Facebook Page. This means that a lot of my time is spent planning and scheduling content, with not as much time as I would like spent collecting evidence for the purpose of improving content. I regularly check and download Facebook Insights reports to keep an eye on how our page is doing, and of course I always pay attention to how much interaction a particular post is getting through comments, likes, or shares. Recently, however, I trialed a small experiment to see if I could improve the performance of a particular type of post: a weekly link to the Library’s Books of the Week blog.

Books of the Week is a place to share recommended Library books, usually related to a current event such as the Olympics or the beginning of semester. In the past, a feed was created so all new blog posts would be automatically posted to the Facebook page. This was causing a number of problems, such as the timing and number of posts becoming unpredictable, and the posts being poorly formatted in Facebook. Most importantly, the Facebook posts coming automatically from the blog were getting zero engagement, and the Reach of the posts was very low. A change was clearly needed.

I decided to stop the blog posting automatically to Facebook, and manually post the item myself. I created a simple graphic to be used each week, and posting manually meant I could write the accompanying status to be more timely and unique. Even though manually posting the item each week only takes a few minutes, in terms of my job description and job performance I knew I would need to justify if this increased manual work was worth the effort.

Based on an experiment described in this article, I started a log of the variables when posting Books of the Week each week. The log included a link to the post, a description of the post such as the image dimensions, length of the accompanying status, and the time and date of the post. Then, each week I recorded the basic units of measurements for the post provided by Facebook: the Reach and the Post Clicks. I was less interested in likes, comments, and shares in this instance – of course I kept a record of them in my log – but metrics like Reach and Post Clicks are sufficient to see if people are engaged with your content without taking the extra step to ‘like’ a post: “…just because someone didn’t click on your specific post, if that post encouraged them to click anywhere else on your page, you’ve done a good job!” (Cohen, 2014)

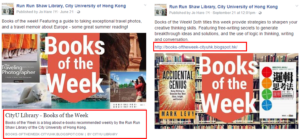
For the first four weeks, I saw marked improvement in terms of the Reach, rising from 43 in the first week to 185 by the fourth week. At this point, I tweaked the method of posting. Rather than posting a link then adding the graphic as an attachment, I posted the graphic as a photo, with an html link in the description. Crucially, after digging into my Insights reports I found Facebook categorises the first type of post as a ‘Link’ and the second type as a ‘Photo’. The difference is very small in practice, and looks like this:

figure1_sample-fb-posts_jhare
Fig 1: Image on the left shows a ‘Link’ post type. The second image shows a ‘Photo’ post type.

After making this change, the increase in the post’s Reach was remarkable – the figure jumped to over 500. Over the next 6 weeks I continued this method of posting, and the posts consistently reached over 800 users. Once in the six week period I reverted to the first method, and the Reach dropped to 166. I returned to the second method, and the Reach increased again, which has remained at or above 800 since I stopped keeping a record of the variation each week.

Much of the literature and the marketing material about using Facebook recommends that page managers use images to engage their audience, so I suppose these results are not surprising. I did not however expect there to be such a difference in Reach simply because my post originated as a ‘Photo’ rather than a ‘Link’, when the content is essentially the same.

The general visibility of the posts was much improved with this method, but the change in the actual click through rate to the blog was less dramatic. On average around 5 people each week clicked on the post. My Insight reports show 2-3 of the clicks were to expand the image or description, while on average 0-1 people clicked the link to visit the blog. Quite disappointing!

Despite this, I do not think the exercise was in vain. Firstly, seeing for myself that images truly do have a greater Reach according to Facebook’s algorithm is useful for all future posting practices. Secondly, I think it is valuable to have our posts become more visible on Facebook, increasing our presence on the platform in general. It seems that the manual effort (which is really only around 10- 15 minutes each week – especially now as my colleagues assist in drafting the text and modifying the image!) is worthwhile given the marked increase in the post’s Reach, and the small increase in people who are clicking on the post. This is just a small scale way of using Facebook Insights, and in future I hope to use Insights more strategically in designing and delivering the Library’s Facebook content. In the coming weeks I will be experimenting with a more coordinated approach to Facebook including a paid advertising campaign, and I look forward to sharing some of the results with the C-EBLIP community.

References:

Busche, L. (2016, February 20). 10 Marketing Experiments You Can Run Yourself to Improve Your Reach on Social Media. Retrieved September 27, 2016, from https://designschool.canva.com/blog/marketing-experiments/

Cohen, D. (2014, August 6). Post Clicks, Other Clicks Are Important Metrics for Facebook Page Admins, Too. Retrieved September 27, 2016, from http://www.adweek.com/socialtimes/post-clicks-other-clicks-are-important-metrics-for-facebook-page-admins-too/300388

This article gives the views of the author(s) and not necessarily the views of the Centre for Evidence Based Library and Information Practice or the University Library, University of Saskatchewan.