NGC 5749 is an intermediate-age cluster in the Southern constellation of Lupus. It was first discovered by James Dunlop in 1826 but also observed by John Hershel in 1834. It is located roughly 3,262 light years from the sun and is considered to be a poorly populated cluster that shows a low level of concentration.
In a fairly recent study in 2007, M.M Vergne, C.Feinstein and R. Martinez determined that visual absorption affecting the stars in NGC 5749 is partially produced by a dust layer located roughly 300pc from the Sun and also by a second layer of dust closer to the cluster about 700 pc away from the sun. Upon the observed photometry and polarization data, the data also shows consistency showing the existence of dust within the cluster. This highlights the effect reddening and visual absorption can have on observations and gathering accurate data.

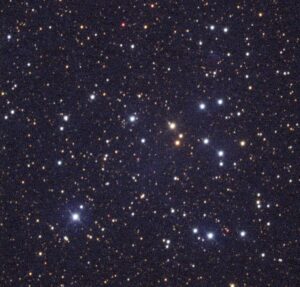
In order to study cluster NGC 5749 and investigate the relationships between the colors, brightnesses, age, and chemical composition of the cluster as a whole, I collected a total of 15 images using a telescope. I used the telescope PROMPT-5 at the Cerro Tololo Inter-American Observatory in Northern Chile using the filters B, V, and R. As well as using other imaging parameters, the B filter had a total exposure of 375s, V had a total exposure of 150s and R had a total exposure time of 100s. The total is between five photos in each filter and was achieved by using Skynet. I used Afterglow to add color to the photos and do a photometric analysis of the cluster. I also used Cluster Pro Plus to then plot NGC 5749 on a Hertzsprung-Russel Diagram. Shown below, I found that the distance is roughly 1.29 +/- 20%kpc away, its proper motion in RA to be -2.76 +/- 0.125 mas/yr, its proper motion in DEC to be -3.07 +/-0.409 mas/yr, and is roughly 40 million years old!

The results that I found were interesting, but tough to confirm any conclusions. The open cluster that I had chosen is a very poorly populated cluster and a very low level of concentration. I found it very interesting that the star cluster was so loosely populated, and that in the photo there is a very bright star in the bottom right. There is one blue straggler in the BP-RP graph, which I find very interesting but am concluding that the blue straggler is the very blue star in the bottom right of the photo. I think this is a straggler because it seems a lot more luminous than the other blue stars in the cluster but is unsure if this is because it is closer than the rest of the cluster. There is one reddish star in the photo but does not seem to be of anything out of the ordinary. There are a few very red stars in the background around the photo that are most likely red giants but are not within the cluster so are irrelevant to our analysis. The lack of density in the cluster made it very challenging to manipulate the Isochrone to fit its proper parameters.
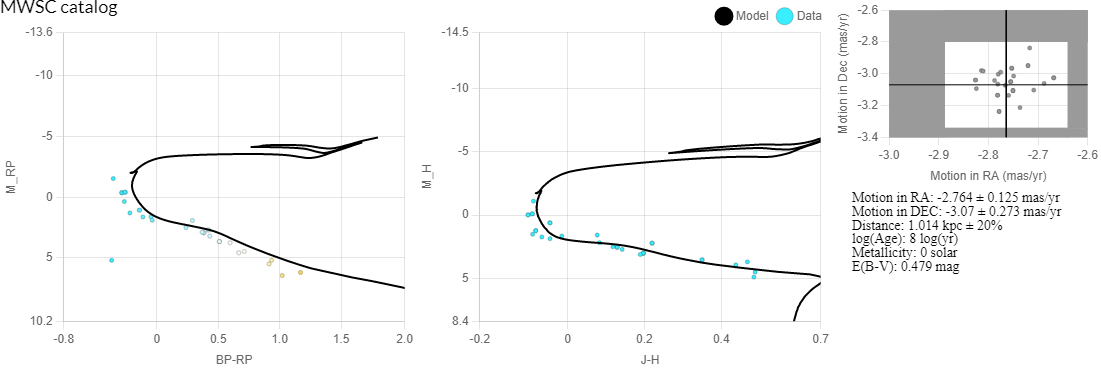
My cluster in the shared classroom spreadsheet stated the distance was 1.014 +/- 20%kpc, the log(Age) is 8log(yr) and E(B-V) is 0.479mag. I plotted the Gaia data with these parameters and what I found interesting is the results I had attained in the M_RP Vs. BP-RP graph is more accurate in following the motion of the stars than the MWSC graph. The main difference between the two is the graph with my data has a further distance but a younger age. Unlike the M_RP graph, the MWSC graph M_H Vs. J-H is much more accurate than the graph with my data. The data points follow the line much more cleanly and have less scattered data. I think that this was due to the difference in age, distance, and metallicity which may have been impacted by the strong presence of dust and the lack of concentration in the open cluster, and possible human error is done by myself.
Overall, this project has enlightened me on plenty of new topics of study such as open clusters and learning how to collect data and visually display it. The project has been very rewarding and has really enjoyed learning new things that are now of high interest to me.
References:
https://skynet.unc.edu/telescopes/view?id=21
https://skynet.unc.edu/obs/view?id=8902847
http://simbad.cds.unistra.fr/simbad/sim-ref?bibcode=2007A%26A…462..621V
https://cseligman.com/text/atlas/ngc57.htm
https://en.wikipedia.org/wiki/NGC_5749
https://in-the-sky.org/data/object.php?id=NGC5749
https://docs.google.com/spreadsheets/d/1jPRPEZXaXSAfcmcafCuYDtwZs3YIFzyPIrLSHwuT01w/edit#gid=0