by Chris Chan
Head of Information Services at Hong Kong Baptist University Library
Despite having worked in academic libraries for almost ten years, and taken two graduate degrees that included research methods courses, I must confess that my level of comfort with research data collection and analysis is not terribly high. My lack of confidence manifests itself particularly in the use of specialised data analysis software packages.
Studies that make use of such tools (e.g. NVivo and ATLAS.ti) are becoming increasingly common. Woods, Paulus, Atkins, and Macklin (2016, p. 602) used the Scopus database to confirm that the number of published articles that made use of one or the other of these qualitative data analysis software titles has grown significantly in recent years. I have found this to also be reflected at my institution, where our library has received an increasing number of enquiries about NVivo in particular. Apart from this contextual need to become more fluent in these data analysis software packages, as a social sciences subject librarians I personally feel a strong professional desire to deepen my understanding in this area.
As every instruction librarian knows, teaching or learning specialist skills in a vacuum is difficult. If there is no practical application for what is being learned, staying motivated will be a challenge. I was therefore fortunate to have a recent opportunity to gain practical experience with using NVivo as part of an action research project in partnership with a faculty member. This grew from an invitation by the faculty member to collaboratively co-teach a postgraduate research methods course. We adopted an embedded librarian approach. In addition to leading a traditional instruction session, I also attended several of their regular classes and was active in the course’s learning management site.
The depth of this collaboration between librarian and course instructor was new to both myself and the faculty, and this level of partnership is certainly uncommon at our university. We were thus naturally keen on assessing how effective this approach was in enhancing student learning. We were inspired by the action research undertaken by Insua, Lantz, and Armstrong (2018) in which the researchers asked students to reflect upon their research process via structured research journals, which were subsequently coded and analysed using NVivo. The authors reported that these “qualitative data yielded valuable insights into the research process from the student’s point-of-view”. In asking our own students to complete a similar task, we intended to also analyse the results to gain insights into their development of information literacy abilities and dispositions.
Apart from the obvious benefit that this enterprise would have on my teaching practice, the idea appealed to me in that it represented an authentic need to learn how to use NVivo. Prior to embarking on this project, I knew very little about NVivo beyond the name and the fact that it was used for the analysis of qualitative data. In response to feedback from our library’s users, I had been involved in making the software itself available on library PCs and laptops. However, my own practical experience with NVivo was zero. My first step was therefore to access a beginner’s introduction through an institutional subscription to Lynda.com. This was great for learning basic concepts and terminology and required less than ninety minutes.
After learning the ropes, my first step was to import the student journals into NVivo. We had asked them to submit their journals using Google Sites. Getting this content into NVivo was surprisingly easy to do using the NCapture browser extension. With one click, the entire content of a web page can be saved as a .ncvx file. These can then be uploaded in a batch to NVivo for organization and coding.
Once all of the data was imported, I experimented with coding a small proportion (10%) of the journal entries. I then sought feedback on the coding structure from the faculty. Once this was incorporated, I began coding in earnest. This was a time-consuming and labour intensive process. I completely agree with Carolyn Doi, who in her earlier post on Brain-Work about Nvivo states that “coding is made easier with NVivo, but the software doesn’t do all the work for you.” I found maintaining focus and attention during coding to be a challenge, and I had to split the work between multiple different sessions.
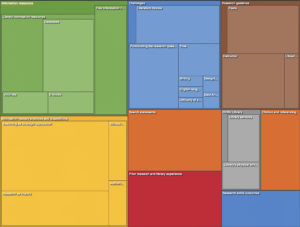
The effort did pay off, as once the coding was done I was able to start playing around with some of the analysis and exploration features of the software. Some are very intuitive, such as the treemap pictured in Figure 1 below that allows you to visualize your coding hierarchies. This allows you to see at a glance some of the more prominent themes based on coding frequency. Some of the other features (such as the various different queries) are more opaque, and I will need to dedicate more effort to understanding the purpose of these and whether they will be useful to the analysis for this project.

Figure 1 – Treemap produced using NVivo 12 Mac (click on image for clearer version)
So far my experience with NVivo has been good, but I clearly have a long way to go before I become a proficient user of this software package. My motivation remains high, as apart from using NVivo in research projects, I would like to be able to answer patron enquiries about the software and possibly even run workshops on its use.
References
Insua, G. M., Lantz, C., & Armstrong, A. (2018). In their own words: Using first-year student research journals to guide information literacy instruction. Portal: Libraries and The Academy, 18(1), 141–161. https://doi.org/10.1353/pla.2018.0007
Woods, M., Paulus, T., Atkins, D. P., & Macklin, R. (2016). Advancing qualitative research using qualitative data analysis software (QDAS)? Reviewing potential versus practice in published studies using ATLAS.ti and NVivo, 1994–2013. Social Science Computer Review, 34(5), 597–617. https://doi.org/10.1177/0894439315596311
This article gives the views of the author and not necessarily the views the Centre for Evidence Based Library and Information Practice or the University Library, University of Saskatchewan.


