By Rielly Castle, Alexander Magnus, and Ali Ahmed
Abstract
Globular clusters are important astronomical objects that provide deep insight into the early evolution of the universe. Our study utilizes photometric techniques to measure the apparent B and V magnitudes of the stars in the globular cluster NGC 2298. We produced a Hertzsprung Russell diagram of the cluster to identify the various stages of stellar evolution present within. Our measurements also revealed blue straggler populations, which in turn helped us determine a lower bound approximation for the age of the cluster.
Introduction and Background
The main goal of our research was to photometrically analyze NGC 2298. This analysis allowed us to determine where on their evolutionary path the stars of the cluster currently sit, which in turn helped inform an approximate age of the cluster. To find such information, we cataloged each star and its apparent B and V magnitudes, calibrating them to a known reference star. From this, we can determine each star’s B-V index and since each star in the cluster is approximately the same distance away from Earth, apparent V magnitude is roughly equivalent to absolute magnitude. From here, we plotted an H-R diagram with each star’s apparent V magnitude plotted against their B-V index, to visualize the evolutionary position of the cluster.
Overview: Globular Clusters
Globular clusters are vast, tightly packed groups of stars orbiting around a common gravitational center. They are thought to be some of the oldest objects in the universe because of their unique composition of different star types, and the chemical composition of the stars themselves. The stars in these clusters are thought to have formed at roughly the same time as each other. For these reasons, globular clusters are extremely interesting and useful objects for studying the evolution of the cosmos. For our project, we chose to study the globular cluster NGC 2298. We hoped to uncover the various stages of stellar evolution present in the cluster’s population, and also determine an age approximation of the cluster as a whole.
NGC 2298
NGC 2298 has been known by astronomers since 1826 and is located in the southern constellation of Puppis at RA: 06h 48m 59.4s, Dec: -36° 00′ 19”. It has an apparent V magnitude of +9.3 from Earth. It also contains three known reference stars that can be used for calibrating the B and V magnitudes of each star in the cluster. It also has a Shapley-Sawyer concentration class of VI, indicating an “intermediate mild concentration” of stars in the center. The cluster is not an extremely dense one, which is important for our study because individual stars in less densely packed clusters are more easily resolved and measured. The cluster is 12.36 kpc from our Sun and has a radial velocity of +64 km/s,1 with a recorded core radius of 0.31 arc-minutes 2.
B – V Indices of Stars
The B-V index, also known as the color index, is the magnitude difference between light measured through astronomical B and V filters. A B filter measures light from wavelengths of about 400-500 nm, while a V filter measures light from wavelengths of about 500-700 nm. This information can be used to determine the color and temperature of a star because stars can be treated as approximately perfect black bodies.
H-R Diagrams
One of the most important aspects of our study is the Hertzsprung-Russell diagram. An H-R diagram is a scatter plot that maps each star’s absolute magnitude versus its temperature. The apparent V magnitudes from our measurements are approximately equivalent to absolute magnitudes because all the stars in the cluster are essentially the same distance away. Similarly, the temperature is roughly equivalent to the star’s B-V index. This plot is extremely useful for identifying well known evolutionary trends and groupings of stars, such as the horizontal branch, main sequence turn-off point, blue straggler district, etc. Together, these trends paint an excellent picture of the cluster’s history and the prospective future of its stellar inhabitants.
Methodology and Data Collection
In the first stage of data collection, we photographed three sets of images on separate nights: Feb 12th, Feb 19th, and Mar 2nd. All three sets contained 10 images taken through each of the B and V filters, for a total of 20 images per set. The photographs were all taken by the PROMPT 5 telescope. The first series of images were exposed for 10 seconds, while the second and third were exposed for 12 seconds. Ultimately, the Feb 19th set was discarded due to poor image quality. To process these data sets, we stacked all 10 of the images in each of the B and V filters using Maxim DL. Our 12 second exposure set was much clearer, so we opted to use this set of images solely. From these images, we were able to clearly identify and catalog 100 stars. Next, we used Maxim’s photometry tool in conjunction with the known B and V values of our reference stars to determine the apparent magnitude of each star through both filters.
In order to reach dimmer levels of magnitude, we decided to photograph a larger final set of data on Mar 11th. For this set, we took 15 images at 120 seconds of exposure through the B filter, and 45 photos at 40 seconds of exposure through the V filter. This new data set allowed us to observe and measure stars that were roughly two levels of magnitude higher than we were previously capable. Again, we stacked the new set of images in Maxim and used the photometry tool to remeasure the original 100 stars, along with 185 newer and fainter ones that couldn’t be detected in our original image set.
Analysis
In the first part of our analysis, we looked briefly at the dimensions of NGC 2298. A horizontal measurement of the core yields a radius of 0.33 arc seconds, and a vertical measurement yields 0.32 arc seconds. This gives us an average radius of 0.325 arc seconds, which agrees with previous measurements of the cluster within experimental error.1 In addition, we found that the cluster’s average diameter extends out to about 3.375 arc minutes.
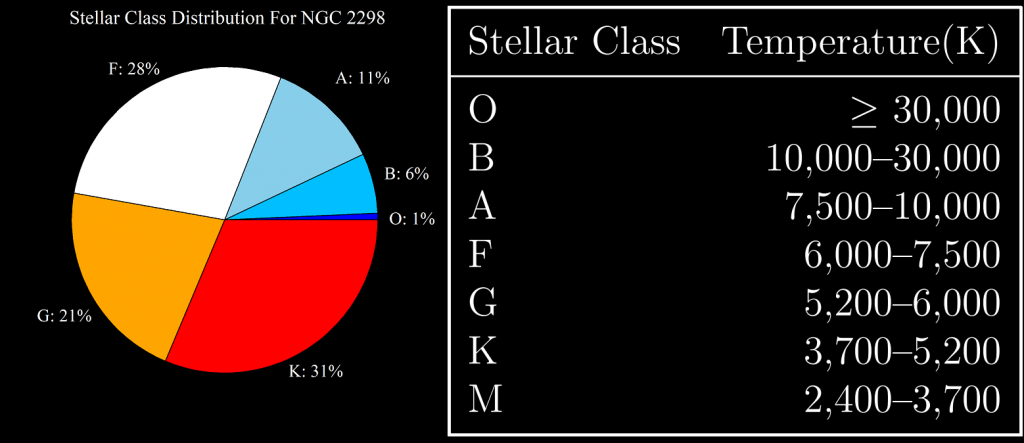 Next, we looked at the photometric data collected from our cataloged stars. Using the B and V magnitudes measurements, We calculated B-V indices for each of the 285 stars using Microsoft Excel. With these values, we calculated the approximate temperature of each star. These temperatures enabled us to establish their stellar classification and the abundance of each class in the cluster. The stellar classes were determined according to the adjacent table. From the set of stars that we observed, about 80% are F, G, or K type stars.
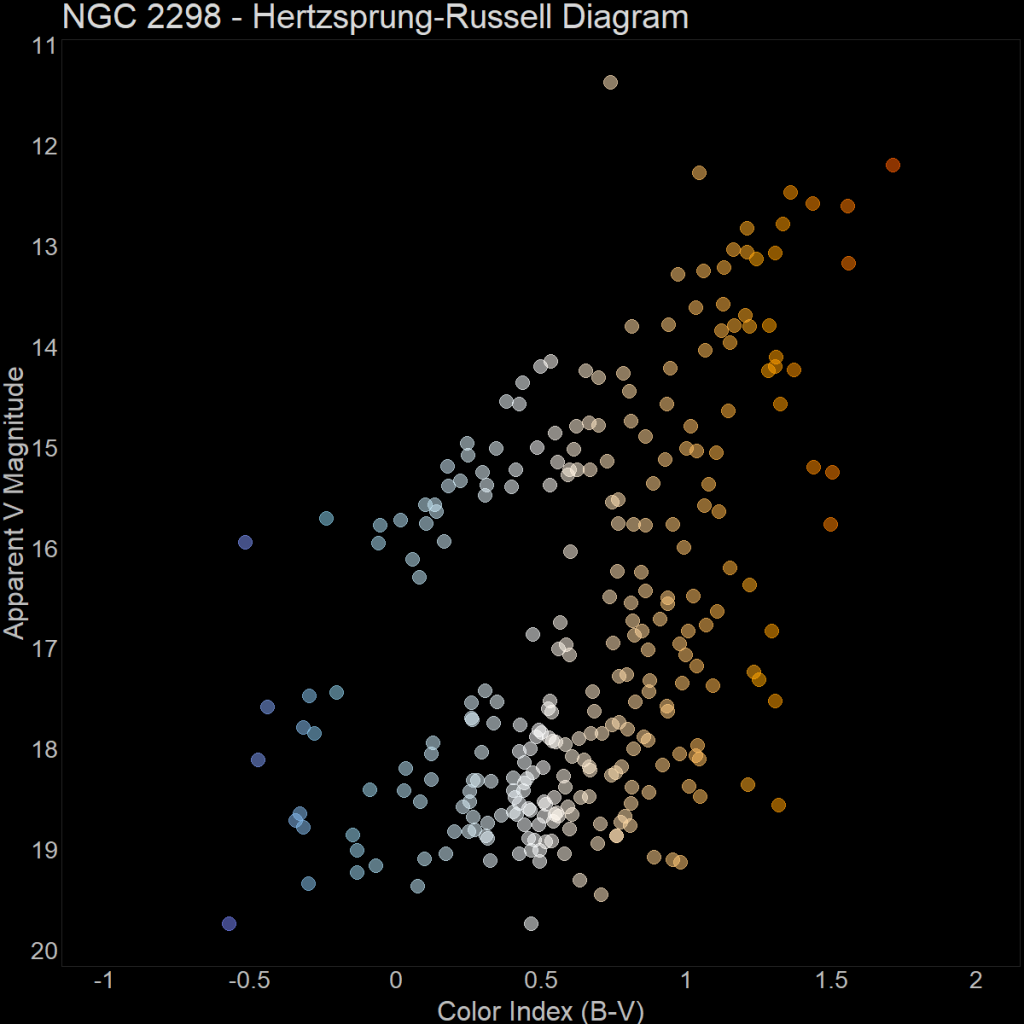
Finally, with our B-V index data, we were able to plot an H-R diagram in R using ggplot2. From the first 100 stars, we could see up to a maximum magnitude of about 17. Our additional 185 stars allowed us to see magnitudes up to about 19. The stars in the cluster spanned a magnitude range of about 12-19. The brightest star we discovered had an apparent V magnitude of almost 11. However, this was likely a field star: one between us and the cluster.
Discussion
Initially, the main goal of this project was to attempt to produce a quantitative age value of NGC 2298. Unfortunately, the data we were able to gather was not sufficient for this task. Since we could only see magnitudes up to about 19, we unable to fully capture the main sequence turn-off point. According to a paper by Stephanie Monty et al., the turn-off point should be between 19 and 19.5 apparent V magnitude, and the main sequence strip extends down to 21 and beyond.3 In our data, only the very tip of the turn-off is visible. Since it is so close to our limit of brightness, we assume that the majority of the 285 stars that we measured are past the main sequence. The only main sequence stars that we are likely to encounter are 1) blue stragglers and 2) the few that are right on top of the turn-off point, just about to end their main sequence lifetimes.
Although our H-R diagram does not show the full turn-off point, it still contains plenty of other interesting stages in the cluster’s evolution. We were able to identify the giant branch, horizontal branch, asymptotic giant branch, and the blue straggler region. In this cluster, the vast majority of the stars that we observed have evolved past the main sequence and entered into the giant portion of their evolution. Those on the red giant branch have begun hydrogen shell burning, and will eventually fall to the horizontal branch as they settle into helium fusion and their size stabilizes. We also captured the asymptotic giant branch, where the helium shell burning begins around a carbon and oxygen core. The presence of such highly evolved stars indicates that we are looking at a fairly old cluster.
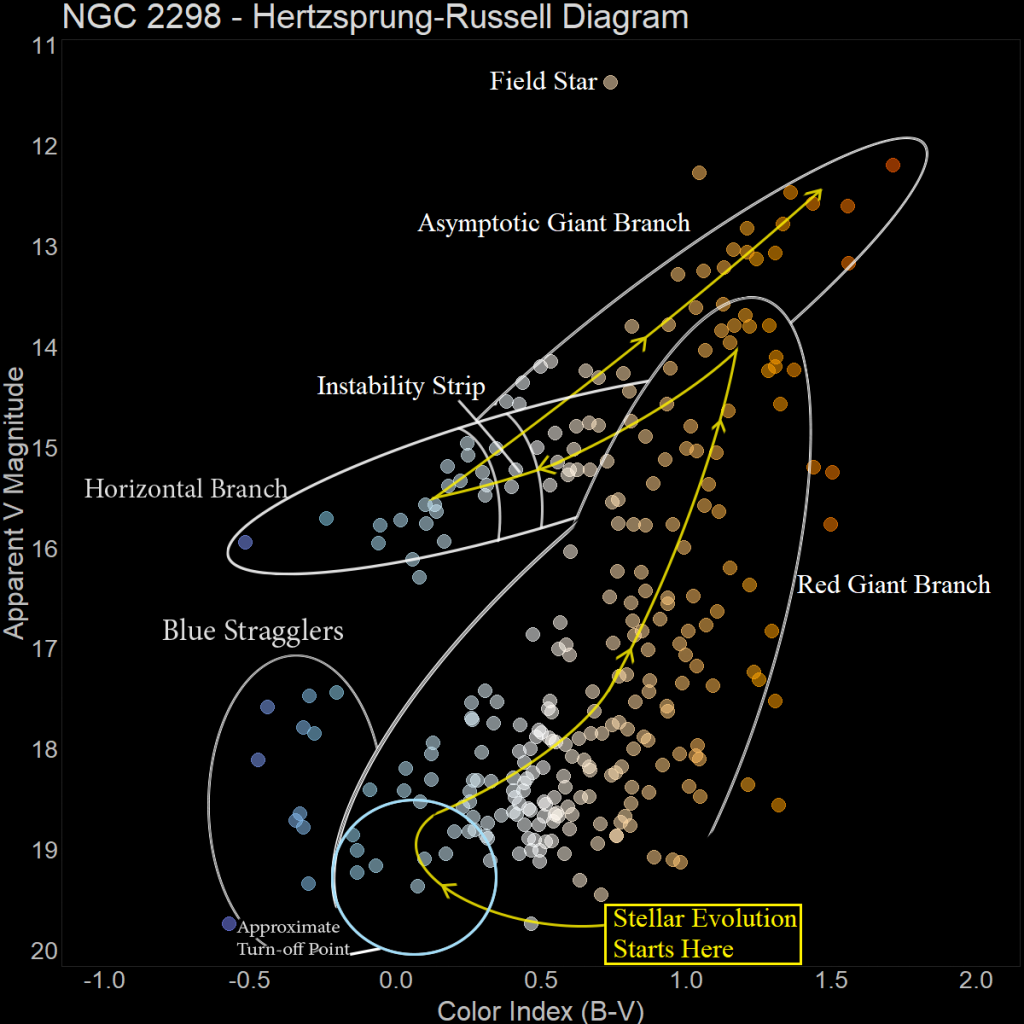
We can make other conclusions about NGC 2298 from our data as well. Looking at our H-R diagram, we see that the difference in magnitude between the tip of the giant branch and the region of the horizontal branch differs by about 2.5 magnitudes. This is characteristic of a metal-poor cluster.1
Another feature we see is the abundance of different star types. Of the 285 stars we observed, approximately 53% of them were made up of G and K type stars, which are relatively cooler types of stars. We expected a greater abundance of these types of stars in older clusters. Observing images of this cluster, we are able to see that it has succumbed to mass segregation, meaning the heavier stars have traveled to the core of the cluster, leaving the lighter stars on the edges.4 This is a characteristic of old clusters and a process that strongly affects the way globular clusters are shaped.
Finally, we used the distance found in a previous study to determine the absolute magnitudes in V and B of these stars.1 With these values, we were able to determine an approximate luminosity of the stars with the distance modulus equation. Since blue stragglers by definition exist behind the turnoff point, we were able to use their position on the H-R diagram to determine a lower bound of the cluster’s age. In other words, the cluster must be at least as old as the blue straggler closest to the turnoff on the diagram. By using the luminosity values calculated above, we utilized the main sequence-mass luminosity relation to find the lifetime of the blue stragglers. The oldest of which had a lifetime of approximately 5.4 billion years. This indicates that our cluster is at least 5.4 billion years old.
Sources of Error
Our most significant source of error comes from background light given off by the moon. Though we planned our data collection to be taken at times when moonlight was minimal, we still took most of our images when the moon was about 30%. Some of this light would still have registered by the camera, changing our measured magnitudes across a gradient in the image. This generally affects B measurements more than V.
Our second source of error is atmospheric aberration. When light travels through the atmosphere, it passes through gasses of different temperatures and compositions, which have different air masses. This causes various different focusing errors, blurring and obscuring the fine details of our images. To overcome this, we would have to use a telescope outside of earth’s atmosphere.
Finally, interstellar reddening may also have affected our data. It is caused by the extinction of light due to the presence of various dusts and gases between us and the cluster. Since blue light is more easily lost when travelling through interstellar matter, the light we receive appears redder than it’s true value. Since this cluster is upwards of 10 kpc away, there is likely to be a noticeable degree of reddening in our values.
Conclusions
From our research, we were able to discover a lot of information about the cluster using just photometry. This cluster is an old object with many of its stars far past the main sequence. The majority of the stars we measured appeared to be giants, occupying the red-giant, horizontal, and asymptotic giant branches. As well, stars appeared to be mostly F, G, and K types which imply an older cluster; the hotter stars have already burned away. Finally, the presence of blue stragglers allowed us to determine a lower bound for the age of the cluster of approximately 5.4 billion years.
Future Work
In order to see into deeper magnitudes and identify the turn-off conclusively, we could take significantly longer exposures, or use a larger telescope. The latter of these options provides the most potential to improve our data. This would enable us to determine a concrete age value instead of an estimate based on various clues related to the cluster’s age.
Spectroscopy could also be an interesting addition to this project, as it would give us some insight as to the chemical content present in these stars. It would also allow us to determine the metallicity of this cluster, which also has implications about its age. Older stars are generally poorer in metal content than their younger counterparts.
References
[1] G. Alcaino. The globular cluster ngc 2298. Astronomy and Astrophysics Suppl., 1978.
[2] William E. Harris. Catalog of parameters for milky way globular clusters: The database, 2010.
[3] Stephanie Monty. The gems/gsaoi galactic globular cluster survey (g4cs) i: A pilot study of the stellar populations in ngc 2298 and ngc 3201. 2018.
[4] Melvyn B. Davies Ian A. Bonnell. Mass segregation in young stellar clusters. Monthly Notices of the Royal Astronomical Society, 1998.
Special thanks to Reddit user zonination, who’s H-R diagram code served as the basis for the program we made and used.