
We come now to the question, “who cares?” What is the point of all these graphs and all the jargon? We know that farmers and other producers in the agriculture industry are in business to make money whether they are producing food, feed, bioproducts, or even intermediary products that are used in the production of final goods. To sustain families, farmers must produce products in a way that makes enough to cover the costs of production with some money left over to invest in next year’s operations, to save money for retirement or education, and possibly the odd vacation. Businesses need to pay employees and make investments for growth. Big corporations are interested in expanding and providing more goods and services to a growing customer base. All these goals require that production is profitable in the long run.
The production model illustrated in Module 4 helped us to determine how different combinations of inputs could affect output and how using too much of one input could actually cause the output to fall. While we have a good grasp of the characteristics of physical production, we cannot yet determine how much input to use, or how much output to produce because we don’t have enough information. We will now add two pieces of information – cost and price – to figure out the optimal point of production.
Let’s start with a forestry example where the crop is willow used to produce biomass for energy. Right here at the University of Saskatchewan, there is research being done about the effects of soils and growing conditions in Saskatchewan on willow production, and the crop itself as a relatively new cropping option for farmers. In addition to producing energy, this crop can also be used to detoxify soils: growing trees can help to remediate contaminated soils on land that has been used for mining, for example. For a great explanation of how this crop is used to decontaminate soil, you could visit the Poplar and Willow Council of Canada as illustrated below.

Figure 5-1: Poplar and Willow Council of Canada. Trees are also an important crop in the agriculture industry. Source: http://www.poplar.ca/article/genorem-how-willows-decontaminate-soils-176.asp. Permission: This material has been reproduced in accordance with the University of Saskatchewan interpretation of Sec.30.04 of the Copyright Act.
Let’s begin with some assumptions. We will hold land constant, assuming our willow crop size is fixed. We will also hold constant the machinery and labour needed to tend to the crop. Our output will be biomass and measured as mg/ha. And, we will look at the effects of one input – nitrogen fertilizer – on output. Table 1 captures the relationship between the input and the output/total product. You will notice that as fertilizer increases, the total product increases to a maximum of 30.5 mg/ha and then begins to fall as more fertilizer is added.
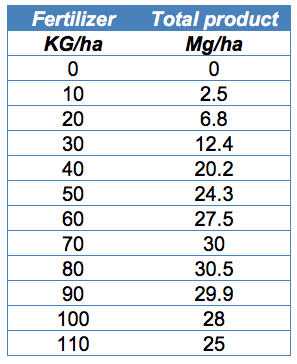
Table 5-1: Total willow production (mg/ha)
as affected by fertilizer (kg/ha). Permission: Courtesy of course author Hayley Hesseln, Department of Agriculture and Resource Economics, University of Saskatchewan.

Figure 5-2: Willow Biomass Demonstration Plot. Source: https://commons.wikimedia.org/w/index.php?curid=34567379. Permission: CC BY-SA 4.0
The graphical representation has the same shape as the production functions we developed in Module 4. Figure 5-2 maps the relationship between fertilizer (kg/ha) and willow biomass (mg/ha).
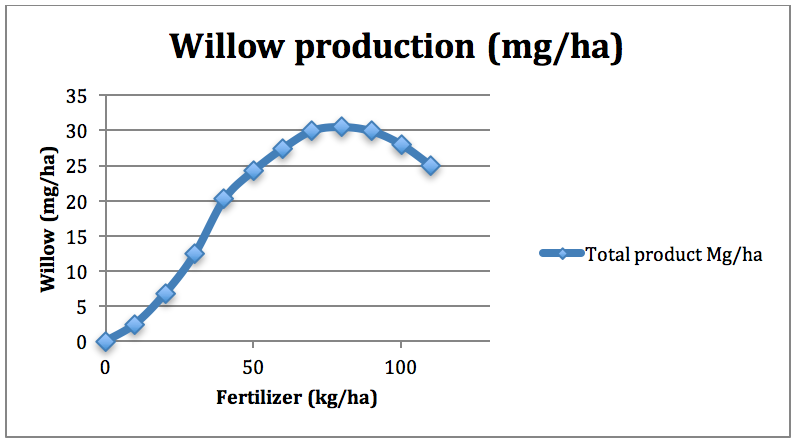
Figure 5-3: Willow production and fertilization. Permission: Courtesy of course author Hayley Hesseln, Department of Agriculture and Resource Economics, University of Saskatchewan.
You will notice increasing returns to scale up to about 15 mg/ha of willow, decreasing returns to scale to about 30 mg/ha, and then negative returns to scale after 30 mg/ha.
The question is how much fertilizer should we use?
To answer the above question, you might say, “it depends.” If you wanted to maximize the growth rate of willow, you’d select the point that corresponded with the maximum MPP. If you wanted to maximize the average quantity of willow, you’d select the point where APP was the greatest. If you wanted to maximize total product, you’d select the amount of fertilizer that corresponded with a total output of 30 mg/ha.
However, the graph above does not tell us how much fertilizer will result in the greatest profit. To answer that question, we need to understand the cost of our willow operation, and the likely price we can get for our product.